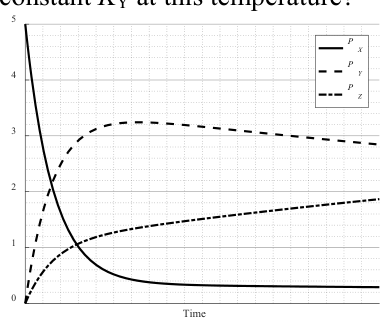
A gas X reacts reversibly and independently to form two different gases, Y and Z: At a certain temperature, the time evolution of the pressures of the three gases are shown. What is the equilibrium constant at this temperature? Time 0 1 2 3 4 5 Partial Pressure (atm)
8% of national qualifiers got this right
Explanation
draftAt equilibrium the partial pressures level off (flat parts of the curves at large ). Reading the graph at :
For the equilibrium :
So , matching (B).
This value (≈3.0) is just the equilibrium partial pressure of itself, mistaking for the equilibrium constant instead of dividing by .
Correct: using the leveled-off (equilibrium) pressures, .
This comes from using the transient overshoot peak of (≈3.2) divided by an early, not-yet-equilibrium value, giving a ratio close to 9.3 instead of the true equilibrium values.
Incorrect—the curves clearly flatten out by the later times shown, indicating the system has reached equilibrium, so can be calculated from the plateau pressures.
USNCO 2020 National Part I exam, question 36. © American Chemical Society; reproduced for non-commercial practice.